
728x90
1. Matplotlib
- matplotlib은 파이썬에서 사용가능한 시각화 라이브러리
- numpy, scipy를 베이스로 다양한 라이브러리와 호환성 좋음 (scikit-learn, pytorch,tensorflow,pandas 등)
- 이외에도 여러 라이브러리(seaborn, plotly,bokeh,altair)가 있지만 matplotlib이 가장 범용적으로 쓰이고 있음
2. Import library
import numpy as np
import matplotlib as mpl
import matplotlib.pyplot as plt # matlab에서 쓰던 걸 파이썬으로 옮겼다고 생각하면 됨
3. 기본 플롯
- Figure라는 큰 틀에, Ax라는 서브플롯 추가해서 만든다
- 다만 서브플롯 최소 1개 이상 존재해야 show()함수 실행 시 시각화 가능(서브플롯은 add_subplot()을 통함)
- 가로, 세로 길이를 tuple형태로 figsize에 전달. 간단하게 비율로 생각하면 됨.
- 예시 코드
fig = plt.figure(figsize=(12, 7)) # 12inch(가로), 7inch(세로) / 12:7의 비율로만 생각해도 무관함
ax = fig.add_subplot()
plt.show()- 하나의 figure에 두개 이상의 플롯 그릴 때 아래와 같이 코드를 짬
fig = plt.figure()
ax = fig.add_subplot(121) # 왼쪽 플롯 설정
# ax = fig.add_subplot(1, 2, 1)로 사용가능 <- 기본 문법임
ax = fig.add_subplot(122) # 오른쪽 플롯 설정
plt.show()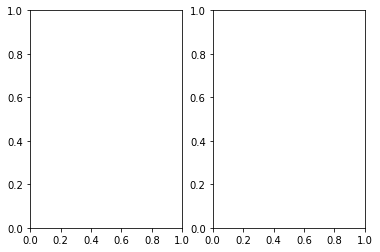
- 서브플롯 객체 ax에 그리기
- plt로 그리는 그래프들은 순차적으로 그리기에 좋지만, 좀 더 pythonic하게 구현을 하려면? ax 객체에 직접 그리자 (Matplotlib은 그릴 때 두 가지 API를 따로 지원)
- Pyplot API : 순차적 방법
- 객체지향(Object-Oriented) API : 그래프에서 각 객체에 대해 직접적으로 수정하는 방법
- plt로 그리는 그래프들은 순차적으로 그리기에 좋지만, 좀 더 pythonic하게 구현을 하려면? ax 객체에 직접 그리자 (Matplotlib은 그릴 때 두 가지 API를 따로 지원)
객체 지향 API
fig = plt.figure()

x1 = [1, 2, 3]
x2 = [3, 2, 1]

ax1 = fig.add_subplot(211)
ax2 = fig.add_subplot(212)

ax1.plot(x1)
ax2.plot(x2)
plt.show()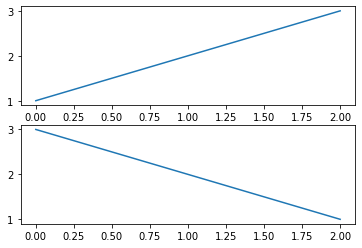
4. 플롯의 요소
- 타이틀 설정
- 범례 설정
- 하나의 서브플롯에 여러 그래프 시각화
fig = plt.figure()
ax = fig.add_subplot(111) # 1by1크기의 1번째에 서브플롯 그리기
ax.plot([1, 1, 1], label='1') # ax.plot(x값 리스트, label='그래프의 라벨 이름')
ax.plot([2, 2, 2], label='2')
ax.plot([3, 3, 3], label='3')
ax.set_title('Basic Plot') # 제목 설정
ax.legend() # 범례 추가
plt.show() # 플롯 시각화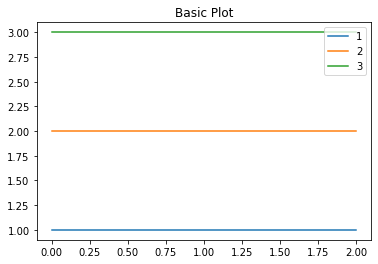
- 메인 타이틀, 서브 타이틀 함께 시각화하기
- 함수 : set_title()(서브 타이틀 설정), suptitle()(sup은 super라는 의미로, 메인 타이틀 설정)
# ax : figure라는 큰 틀에서 만들어진 플롯
# ax의 title은 서브타이틀, figure의 title은 메인타이틀이라고 볼 수 있음
# 각각의 타이틀 지정은 아래와 같이 가능
fig = plt.figure()
ax1 = fig.add_subplot(1,2,1)
ax2 = fig.add_subplot(1,2,2)

ax1.set_title('ax1')
ax2.set_title('ax2')

fig.suptitle('fig') # suptitle의 sup : super
plt.show()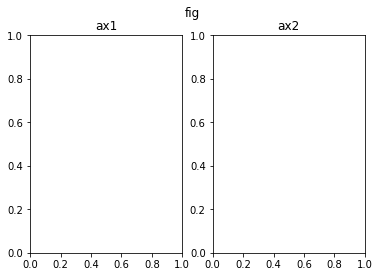
- ticks([x값 리스트]), ticklabels([x값에 상응하는 인덱스 리스트])
fig = plt.figure()
ax = fig.add_subplot(111)
ax.plot([1, 1, 1], label='1')
ax.plot([2, 2, 2], label='2')
ax.plot([3, 3, 3], label='3')

ax.set_title('Basic Plot')
ax.set_xticks([0, 1, 2])
# xticks를 0,1,2 -> 'zero', 'one', 'two'로 변경
# set_xtickslabels 미설정 시 xticks(0,1,2)가 그대로 적용됨
ax.set_xticklabels(['zero', 'one', 'two'])
ax.legend()

plt.show()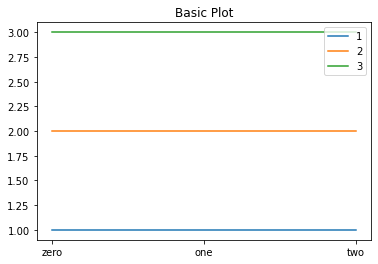
- 텍스트 추가 : ax.text(x=x, y=y, s=s), ax.annotate.(text=text, xy=(x,y))
fig = plt.figure()
ax = fig.add_subplot(111)
ax.plot([1, 1, 1], label='1')
ax.plot([2, 2, 2], label='2')
ax.plot([3, 3, 3], label='3')

ax.set_title('Basic Plot')
ax.set_xticks([0, 1, 2])
ax.set_xticklabels(['zero', 'one', 'two'])

ax.text(x=1, y=2, s='This is Text') # (1,2) 위치에서 첫 알파벳인 T가 시작
# ax.annotate(text='This is Annotate', xy=(1, 2)) 윗줄과 같음
# ax.annotate(s='This is Annotate', xy=(1, 2)) 윗줄과 같음
ax.legend()
plt.show()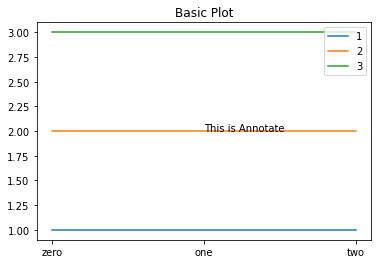
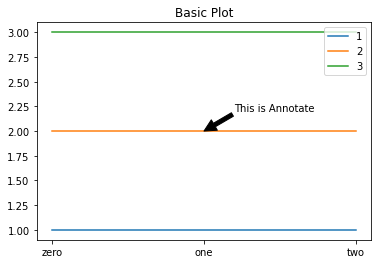
- 플롯 안에 화살표 추가 : 위의 코드에서 ax.text 대신 아래 코드를 넣으면 됨
ax.annotate(s='This is Annotate', xy=(1, 2),
           xytext=(1.2, 2.2), # text(This is Annotate)가 (1.2,2.2)에서 시작함
            arrowprops=dict(facecolor='black'),
           )
728x90
'AI > AITech 3기' 카테고리의 다른 글
| [논문 리뷰] Efficient Estimation Of Word Representations In Vector Space(Word2Vec) (2) | 2022.02.08 |
|---|---|
| [학습 정리] 3주차 (0) | 2022.02.04 |
| [Data Viz] 1-2강 시각화의 요소 (0) | 2022.02.03 |
| [DataViz] 1-1강 데이터 시각화란 (0) | 2022.02.03 |
| [PyTorch] 10강 PyTorch Troubleshooting (2) | 2022.01.28 |